Regression To The Meanest: How Markets Value Pharma Stocks

Executive Summary
Financial markets – the people and institutions that lend companies money and estimate their worth – see pharma companies as revenue-generating, profit-sharing black boxes. Growth earns companies a break from this simplistic view, but sooner or later market valuations of pharmas seem to regress to a mean based on revenue multiples. That mean is getting meaner.
- The markets ride pharma harder these days. Profits are 5% down as a percentage of revenue compared with 15 years ago.
- Yet pharma pays investors back 13¢ on the dollar on average in dividends, and another 6¢ on the dollar in stock buybacks.
- To maintain growth, pharma is borrowing more from the market – the industry's long-term debt now is the same as its revenue, up from 20% at the turn of the millennium.
- So what? While debt can accelerate growth, too much can catalyze collapse. Markets tend to ignore debt until something goes wrong. Then they treat it as an encumbrance and start downgrading company valuations. Valeant has fallen; who’s next?
For people close to it the pharmaceutical industry can appear rather complicated. Its arcane traditions and regulatory complexity woven with the mysteries of research and development and the black arts of marketplace survival create challenging intricacies in the mechanics of running a drug company. The products change, the markets change, the competition moves ahead, rule tweaks favor one company over another, developments falter and different leaders try to adjust the picture to the best of their ability.
Debt: Markets Giveth And Markets Taketh Away
The financial markets – and the people who operate in them – represent one of pharma’s most important dependencies, one that has increased markedly in recent years. For a start, pharma has been borrowing a lot more money lately.
Long-term debt carried by pharmaceutical companies has increased significantly. Consider the longstanding residents of pharma’s top tier, firms such as Pfizer Inc., Merck & Co. Inc., Sanofi, AstraZeneca PLC, Amgen Inc., Eli Lilly & Co. and Bristol-Myers Squibb Co., businesses that were in the pharma top 20 both now and back in 2000. In 2000, for every $1 of revenue these big pharma companies made, they were carrying about 13¢ in long-term debt; by 2016 that ratio was five times higher at 70¢ per $1 of revenue.
For emergent companies such as Teva Pharmaceutical Industries Ltd., Mylan NV, Endo International PLC, Allergan PLC, Valeant Pharmaceuticals International Inc. and Shire PLC, debt is an even more important mechanism in propelling growth: in 2016, the mean long-term debt for these six generic and specialty companies was nearly double their revenue levels ($1.95 debt for every $1 in revenue; range $1.4–$2.95.) (See Exhibit 1).
Exhibit 1
Long-term Debt As A Percentage Of Big Pharma Revenue Has Risen Steadily Since 2000

The green line shows aggregated figures for Pfizer, Merck & Co., Sanofi, AstraZeneca, Amgen, Eli Lilly and Bristol-Myers Squibb.
The red line shows aggregated figures for Teva, Mylan, Endo International, Allergan, Valeant and Shire.
Company reports
The markets have demanded a greater level of stringency in corporate performance. Among the big pharma companies, average operating profits have fallen from around 27% of revenue in 2000 to 21% of revenue in 2016, and net profits have fallen from 21% of revenue to 16%.
Even as profits have declined, however, the level of dividend paid out to shareholders has risen. For every dollar earned in revenue in 2014–16, established pharma companies on average paid 12.5¢ to shareholders in dividends, compared with 8¢ per revenue dollar back in 2000–02. They also handed over another 6¢ per dollar of revenue by buying back stock from existing shareholders.
Between 2011 and 2016, these seven firms collectively returned $270 billion to equity investors, equivalent to 20% of their combined revenues in that period.
Easing the flow of capital to and from the financial markets is increasingly important in the business of running pharmaceutical companies. So understanding how markets think about pharma is key for any management team.
The Market’s Model Of Pharma Is Simple
For all the asset-by-asset net present valuation spreadsheets circulated by brokerage firms, the way in which traders attribute value to pharmaceutical companies is shockingly straightforward. Analysts may factor in launch programs and the impact of timing and competition, but those who invest in drug company stocks reckon there is a linear relationship between annual product revenue and the valuation (market capitalization). In other words, despite flowery rhetoric, markets calculate pharma’s value by multiplying its revenues by a constant factor. (See Exhibit2.)
The evidence for this is shown in Exhibit 2a, which for 18 different top-tier drug companies over a 16-year period shows the correlation between market capitalization and revenue. The strong linear relationship between the revenue and its market capitalization is clear.
The consistency of this relationship may be surprising to those in the industry given that the 18 companies covered take quite different approaches to their pharma businesses. (See sidebar, "Why We Examined These Companies.") Some focus on generic drugs, others on biopharmaceuticals; some have grown rapidly through acquisition or product development, others have shrunk from past glories; many are headquartered in the US, but many are European (either historically or for tax purposes).
Those operating in the financial markets may be cognizant of and sensitive to this variety of backgrounds, and they may understand that each pharma company is itself a complex web of interacting disciplines organized efficiently to transform new knowledge into clinically effective products in myriad indications. However, when they look holistically, it appears the financial markets see pharma as a cash-in, cash-out black box.
Furthermore, the markets’ rough estimate of value for the black box is obtained by multiplying product revenues by a constant. For this set of companies over a period of 17 years, that constant is 3.5.
Having said that, an even better fit to the data emerges through two refinements of this basic “value equals k times revenue” model.
The first refinement adjusts for “stock market sentiment,” the openness or otherwise of the financial markets that broadly influences stock price movement and market capitalization. The NYSE Arca Pharmaceutical Index (DRG) is a decent measure of pharma-specific sentiment and indexing for DRG takes much of the fluctuating “market sentiment” toward the pharma sector in general out of the equation. DRG-indexed market capitalization data plotted against revenue are shown in Exhibit 2b.
Two things are apparent from Exhibit 2b. First, the data are tighter: the correlation between sentiment-adjusted market capitalization and pharma revenue is stronger than in Exhibit 2a.
Second, the data split according to the time period involved. In 2007 or before (green circles), market capitalization valuations are more generous relative to revenue. With some exceptions, the green circles are above the line of best fit; the red circles representing post-recession valuations, on the other hand, tend to be below that line.
A second refinement, shown in Exhibit 2c, shows an even tighter fit of the revenue and valuation data. Exhibit 2c applies different values to the multiplier: up to 2007, the value of k in the “market cap = k times revenue” equation was around 5; after 2007, it was closer to 3. That bifurcation of data suggests that the market view of the value of pharmaceutical company revenues flipped, or at least evolved, after 2007. (See Exhibit 2.)
This is still a very simple model of pharmaceutical company value.
What caused the financial markets to adjust their implicit formula is unclear. It could have been the general economic turmoil that accompanied the global economic recession of 2008–09. Barack Obama’s presidency and the extended (and continuing) tussle over the Affordable Care Act may have caused investors to reassess the value of pharma revenue streams. The Pfizer-Wyeth and Merck-Schering-Plough megamergers may have highlighted the paucity of pipelines at big pharma and spooked investors. The impending loss-of-exclusivity of Pfizer’s Lipitor (atorvastatin) may have contributed, too.
Exhibit 2 Pharma Revenue Is The Major Determinant Of Market Value
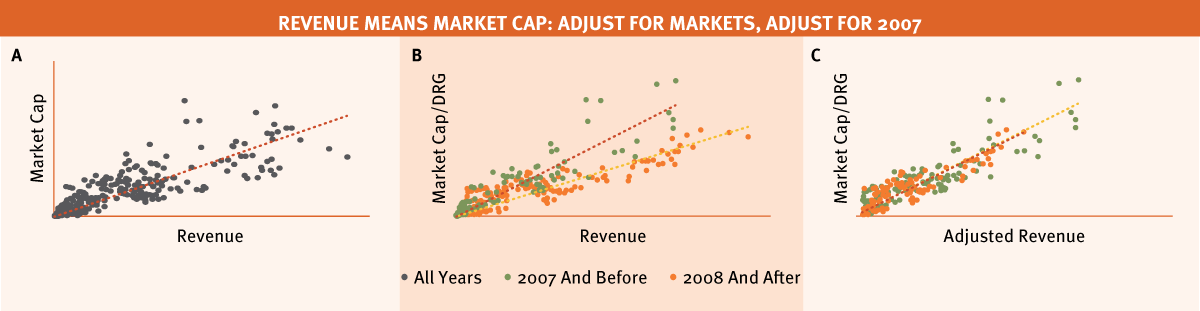
Data shown are based on annual average market capitalization and annual revenue figures for Pfizer, Merck & Co., Sanofi, AstraZeneca, Amgen, Eli Lilly, Bristol-Myers Squibb, Teva, Mylan, Endo International, Allergan, Valeant, Shire, Gilead, Biogen, CSL Behring, Novo and Celgene between 2000 and 2016. In Panel A, Market Cap is plotted against Revenue; in Panel B, Market Cap is indexed against the Arca Pharmaceutical Index to adjust for general market fluctuations; in Panel C, Revenue is adjusted to reflect the apparent market's reevaluation after 2007. Data from 2007 or before shown in green; after 2007 shown in red. Company reports
The flip that occurred after 2007 illustrates that although the hand of the market may be invisible, its collective mind can change. Not only that, it is possible to measure the change. In this case, the data suggest that until 2008, those in the financial markets considered a drug company’s valuation to be about five times its product revenue; after that, the multiplier fell to around three.
Established Pharma
It turns out, perhaps surprisingly, that market views of individual company valuation also largely adhere to a simple revenue-multiple model. This is illustrated in the following sections: valuations derived from revenues compare closely to actual market capitalization based on stock price across a range of drug companies.
What is also clear is that the market view of individual companies can also be inflated by indefatigable optimism about the future or spooked by apparently unexpected business factors, such as the accumulation of debt.
Why debt accumulation is an unexpected factor for financial markets is itself a mystery, given that the numbers are right there in the annual and quarterly reports, and that it is financial markets that do the money-lending.
Exhibit 3
Market’s Model Fits Big Pharma

Each panel shows the fit between the multiple-of-revenue model of company valuation (green) and market capitalization based on stock price (red). The model used applies a 5x multiple of revenue until 2007 and a 3x multiple after that. Actual market capitalization is adjusted for general market fluctuations in the DRG Arca Pharmaceutical Index. Company reports
The previous sections imply that to a first approximation the financial markets have a one-size-fits-all model for valuing companies in the pharmaceutical industry. In the following section, data from individual companies demonstrate that this claim holds largely true for well-established companies and fast-growing companies in generics. For specialty pharma and biotherapeutics firms, the markets make other adjustments.
Exhibit 3 looks at seven established top-tier pharma firms: Amgen, AstraZeneca, Bristol-Myers Squibb, Eli Lilly, Merck & Co., Pfizer and Sanofi.
There is a large degree of agreement between the actual and modeled data for all companies except Amgen. In other words, if you take out the vicissitudes of general market sentiment, the markets’ assessment of the worth of these established pharma companies is based almost wholly on the value of drugs they sell.
Some temporary and company-specific departures are apparent. For instance, the unwinding of the Vioxx (rofecoxib) scandal in 2004 pushed Merck’s actual market value below that estimated from its sales. Similarly, the tide of rising Lipitor sales propelled Pfizer’s traded value upwards in the early 2000s.
But in general, a revenue-multiple model accounts for most of the variation in market capitalization values for big pharma.
In Amgen’s case, the financial markets remain generous in their assessment of the company’s value. Its market capitalization over the last decade approximates to a four-fold multiple of sales rather than the three-fold multiple that appears to apply to other established firms, perhaps reflecting the more robust exclusivity of its biologics portfolio. Even a four-fold multiple is a significant drop from the eight- to 10-fold multiples the company attracted in the inflated post-genomic biotech bubble.
Generics And Specialty Pharma
The relationship between indexed market capitalization and value calculated solely from revenues largely holds for the fast-growing generics and specialty pharma companies in this sample. (See Exhibit 4.) As with the established pharma companies, there is one exception.
Exhibit 4
Debt Is A Factor For Generic But Not Specialty Companies
Each panel shows the fit between the multiple-of-revenue model of company valuation (green) and market capitalization based on stock price (red). The model used applies a 5x multiple of revenue until 2007 and a 3x multiple after that. Actual market capitalization is adjusted for general market fluctuations using the DRG Arca Pharmaceutical Index. In addition, a third orange line shows the multiple-of-revenue model adjusted for the level of long-term debt a company carries. Company reports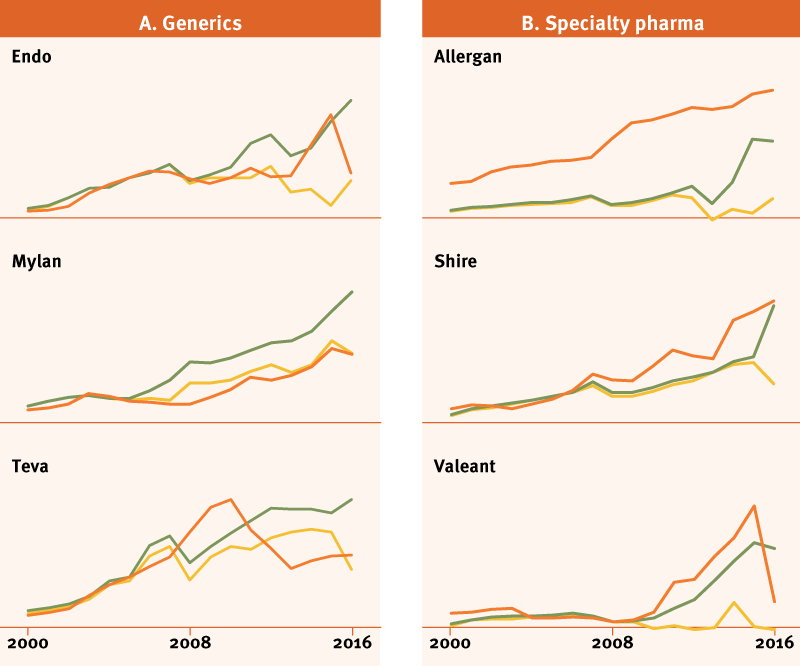
Exhibit 4 shows similar data to Exhibit 3 but for three generics companies: Teva, Endo and Mylan (Exhibit 4a), and three specialist pharmaceutical companies: Allergan, Shire and Valeant Pharmaceuticals (Exhibit 4b).
For the generics companies, there is a reasonable fit between the actual market capitalization (adjusted for general market fluctuations – red line) and a value for market capitalization calculated from revenue alone (green line).
However, for the generics companies there is a better fit if the calculated value includes a downgrade for the level of debt that a company is carrying.
This is clearest for Mylan, where the gap between actual and calculated values is closed when debt is brought into the equation.
The improvement in fit when debt is accounted for is also apparent for Endo International: the market had inflated Endo’s value following its major acquisitions of Auxilium Pharmaceuticals Inc. and Par Pharmaceutical Inc. (in addition to acquisitions of a string of private companies), apparently happy to add the company’s gains in goodwill and intangible assets to its value and to ignore the concomitant uptick in its liabilities.
But when Endo warned of a drop in forecast revenue and profit in February 2016, investors quickly became more aware of both the very large level of debt that the company was carrying and the fragile value of the goodwill it had acquired. Its stock price fell from over $50 at the end of February to under $15 in May. Its price and market value have continued to fall in 2017.
For generics companies, the market seems to recognize (eventually) that debt can reduce value, even when accompanied by gains in assets, and especially so if those assets are as ephemeral as goodwill and intangibles.
Making adjustments for debt doesn’t seem to be an automatic process in making assessments of corporate value, even when debt is prominent on a company’s balance sheet. In fact, if you are a specialist pharma that has plied investors with a convincing growth-adds-value story, debt seems almost irrelevant to valuation. This is surprising, given what has happened to Valeant in the past year and a half.
The Valeant Example
The descent of Valeant’s stock has been well documented – from a market cap of nearly $90 billion in the summer of 2015 to $9 billion less than a year later and now to under $4 billion. But the accumulation of debt began long before the market took note.
For fiscal year 2010, Valeant reported long-term debt of $3.7 billion in the context of revenues of $1.2 billion, a ratio of 3:1. No one seemed to mind. But in 2015, Valeant’s position of carrying $30 billion in debt against revenues of $10 billion suddenly became untenable. Lots of questions were asked even though the debt-to-revenue ratio was identical five years earlier. Perhaps scale matters.
As Exhibit 4b shows, accounting for debt would have attributed a value to Valeant of roughly zero from 2010 onward, a value that is much closer to the market’s current best estimate than the blinded optimism investors actually displayed throughout 2010–15.
Learning a lesson from the Valeant experience, investors could monitor closely the manner in which another specialty company, Shire Pharmaceuticals, handles its newly assumed debt. Since 2009, and even before then, Shire’s long-term debt has been relatively small – equivalent to a third or a quarter of its revenue. But to acquire Baxalta Inc., Shire assumed a debt level in 2016 equivalent to nearly twice its revenue. Investors should be watching to ensure Shire manages to pay down that mountain.
As Exhibit 4b shows, the markets apparently continue to attribute value to Shire based solely on revenue. If Shire can tackle its debt burden, and if former-Baxalta revenues hold up in their new corporate surroundings, this may prove valid; if not, a correction for debt might be needed.
Allergan, too, is a company that investors may need to watch closely. Its market valuation has already fallen to two-thirds of its value at the point when a tax-propelled merger with Pfizer seemed likely. But the market still values Allergan at a considerable premium to the formula it applies to pharma companies in general. Allergan’s March 2017 market capitalization was around $80 billion, not 3 times its reported revenue for 2016, but 5.5 times. And the company still had nearly $33 billion in long-term debt.
The apparently optimistic outlook on Allergan may last if the company continue to pay off its debts.
Biopharmaceuticals And Biotechnology
A simple revenue-multiple model of pharmaceutical company value appears to apply also for high-growth biopharmaceutical firms, although not at the multiples that apply to other companies. Exhibit 5 shows the relationship between actual DRG-adjusted market capitalization (red) and a value calculated from revenue (using the same parameters as elsewhere in this article).
It seems that for companies such as Novo Nordisk AS, Gilead Sciences Inc., CSL Behring, Celgene Corp. and Biogen Inc. the market continues to apply a five-times multiplier to revenue (data not shown). The fit between the modeled and actual market capitalization data is reasonably good up to 2007, and then it breaks down after that. That may change, however, as the data for Gilead illustrate. (See Exhibit 5.)
Exhibit 5 The Sunny Side Of Biopharmaceuticals
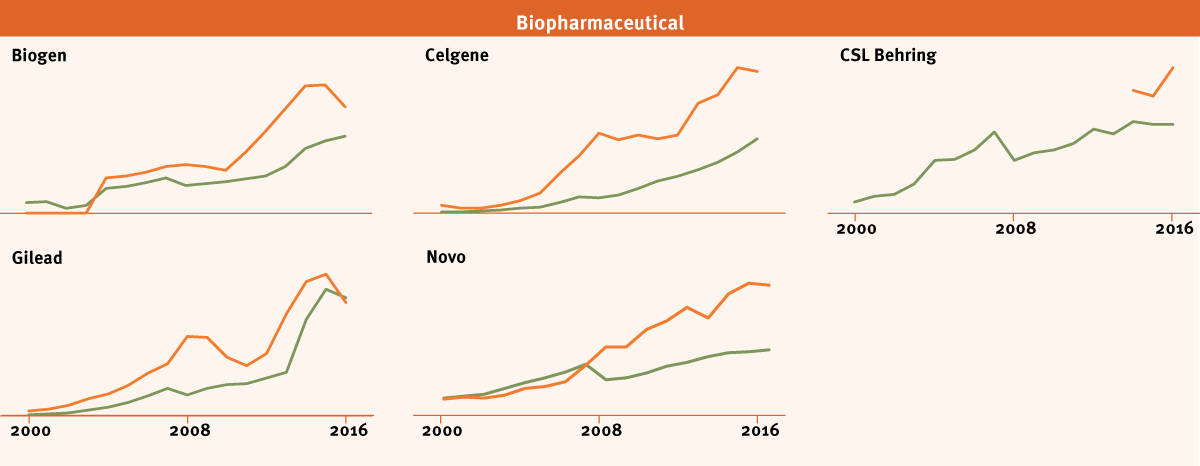
Each panel shows the fit between the multiple-of-revenue model of company valuation (green) and market capitalization based on stock price (red). The model used applies a 5x multiple of revenue until 2007 and a 3x multiple after that. Actual market capitalization is adjusted for general market fluctuations in the DRG Arca Pharmaceutical Index. Company reports
After Gilead’s revenues from its hepatitis C franchise peaked in 2015, the company’s market capitalization reverted to a three-times-revenue model (the actual and model data in Exhibit 5 are resynchronized).
For Novo Nordisk, it only took an announcement in August 2016 that the company’s dividend would be halved to cause stockholders to re-examine the firm. They reducing the company’s market capitalization from around $145 billion to about $85 billion by the end of the year (although that still implies a revenue multiplier of four).
And, as Exhibit 5 shows, the downturn in Biogen’s market capitalization in 2015 and 2016 associated with the discussion of health care costs in the run-up to the US presidential election brought it much closer to a three-times-revenue value.
Take-home Lessons
It seems that although investors may want to put their money to work in ways that are interesting and ethical, they care for the intricacies of pharmaceutical industry mechanistics only to the extent that they influence financial outcomes. For them, pharma is not an R&D machine that develops products that can be sold to health care systems to help patients, it is a black box that when working properly converts equity and debt investments into value creation and financial returns.
As long as the black box works properly, the financial markets take an unexciting but benign view that the value of a drugs company should reflect a multiple of its product sales.
When something is not working properly – signaled perhaps by profits or revenue warnings, or by an expectedly low dividend payment – the markets may want to look inside the black box. Sometimes they don’t like what they see.